Market Morsel: Are Aussie wheat prices good or bad?
Market Morsel
We love to get requests from subscribers. A grain industry representative asked us how our wheat prices in Australia stack up as percentiles. I thought that was an interesting enough question.
Firstly, before we go on. I will use percentile charts in this article instead of the typical percentile table used. I prefer this view as it indicates where the price sat at each point in time.
At its most basic, a decile of 0 is the lowest price for the period, and a decile of 1 is the highest price. The period in this article is 2010 to the present.
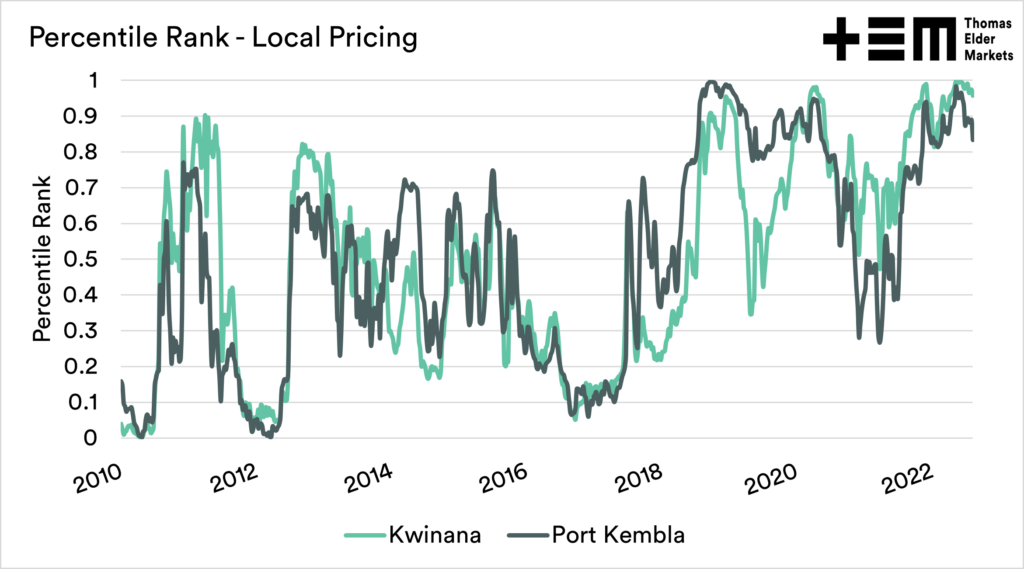
I have chosen spot Kwinana and Port Kembla (APW) as a weekly average. This is a reasonably good representation of values around the country.
In the first chart below the physical price as a percentile is displayed. In reality, we have had some really strong flat prices over recent years. Through 2022, the price of wheat in Australia has been very high.
Despite record crop production, cash prices have been solid, as high or higher in places as the recent drought.
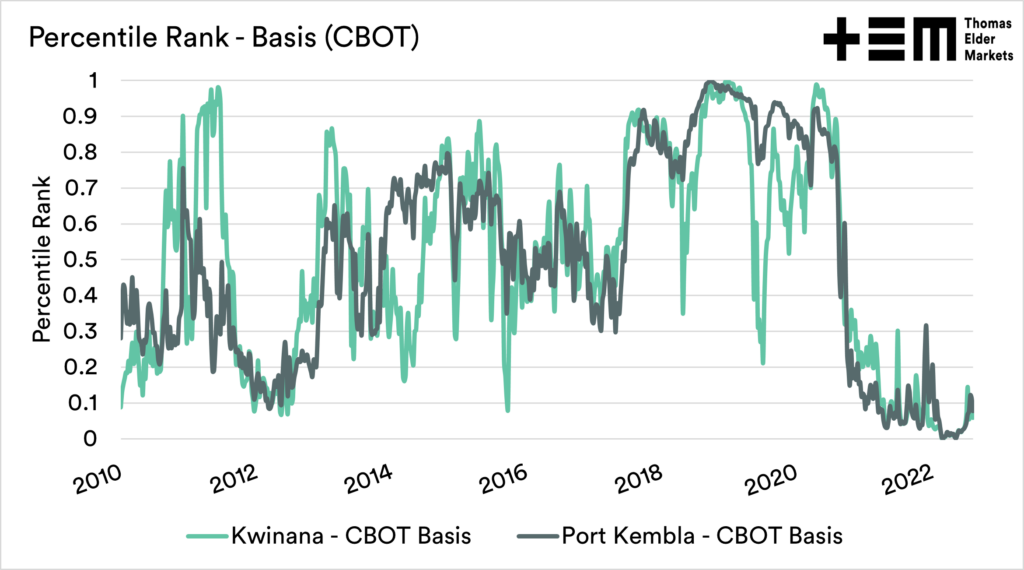
Let’s look at it from another angle. The second chart displays the percentile ranking of basis, our premium/discount to Chicago futures.
While grower bids have been historically strong, the relative value to overseas futures has been low.
So technically, the prices received are fantastic, but relative to overseas values, they are still poor. A low basis is expected in years of large production. Big years will produce big discounts without large investments in infrastructure to improve the export task.
Those who are able to get access to capacity are able to bank substantial margins, something we briefly touched on last week (see here).